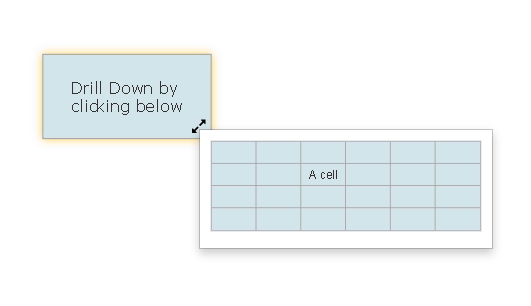
VSON makes it easy to link to source data or drill down to more reports or additional information in a single report.
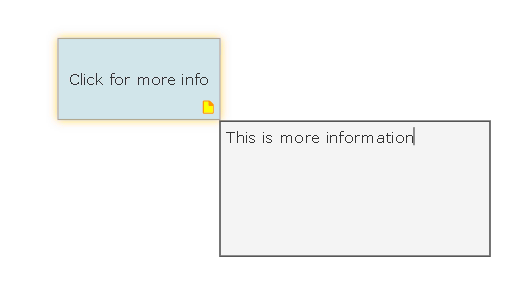
You can add a note to any shape, event, task, or table cell in VSON using the Note property. This creates a tooltip that displays the note in the visual.
{
  "ID": 1,
  "Label": "Engineering",
  "Note": "Engineering owns the core product, infrastructure, and QA functions."
}
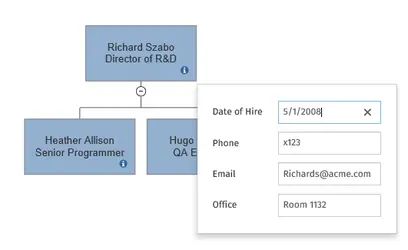
To show more structured data with a drill down, assign a row in a DataTable to a shape or an event using the Data property.DataTables are discussed here.
{
  "ID": 1,
  "Label": "Smith, Jane\nCEO",
  "Data": {
    "TableID": "people",
    "RowID": 1
  }
}
You can add a whole new visual to a shape, event, task, or even a table cell, using the ExpandedView property. ExpandedView is itself a complete VSON Document that appears as a tooltip on the parent.
{
  "ID": 1,
  "Label": "Engineering",
  "ExpandedView": {
    "Version": "1.0",
    "Template": "OrgChart",
    "McpGenerated": true,
    "KeepDocument": true,
    "Shape": {
      "ID": 1,
      "Label": "VP Engineering",
      "ShapeConnector": [
        {
          "ShapeConnectorType": "OrgChart",
          "Shapes": [
            { "ID": 2, "Label": "Frontend Team" },
            { "ID": 3, "Label": "Backend Team" },
            { "ID": 4, "Label": "DevOps Team" }
          ]
        }
      ]
    }
  }
}