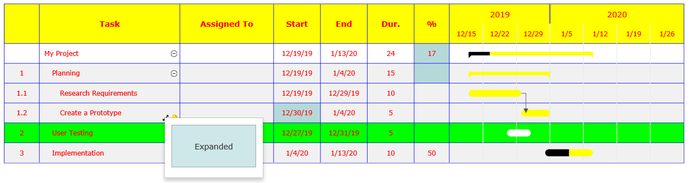
You can add a Gantt chart to any shape using a Gantt object on the shape. A Gantt chart is a specialized object that shows a list of tasks, their dependencies, and their dates inside the shape using a table and a bar for each task.
This document creates an empty Gantt chart:
{
  "Version": "1.0",
  "Template": "Flowchart",
  "McpGenerated": true,
  "KeepDocument": true,
  "Shape": {
    "ID": 1,
    "Hide": true,
    "Gantt": {
      "Projectname": "My Project"
    }
  }
}

The shape that contains the Gantt chart is sized to be large enough to contain the rows and columns of the chart.
A shape that contains a Gantt cannot also contain a table, gauge, or a timeline.
You add tasks to a Gantt chart by adding rows to the UseDataTable.Rows array. Each row represents one task and has a Fields array of {Name, Value} pairs.
{
  "Gantt": {
    "Projectname": "My Project",
    "UseDataTable": {
      "Rows": [
        { "Fields": [ { "Name": "Row", "Value": "1" }, { "Name": "Task", "Value": "Research" } ] },
        { "Fields": [ { "Name": "Row", "Value": "2" }, { "Name": "Task", "Value": "Design" } ] },
        { "Fields": [ { "Name": "Row", "Value": "3" }, { "Name": "Task", "Value": "Build" } ] }
      ]
    }
  }
}
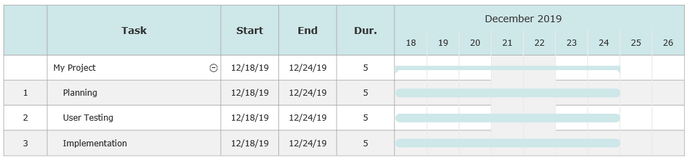
By default, tasks start the day the Gantt chart is created and end 5 working days later.
Set the start date and duration of a task using the Start and Length fields. Start is in "YYYY-MM-DD" format. Length is the duration in days.
{
  "Rows": [
    { "Fields": [
      { "Name": "Row", "Value": "1" }, { "Name": "Task", "Value": "Research" },
      { "Name": "Start", "Value": "2019-12-18" }, { "Name": "Length", "Value": "5" }
    ]},
    { "Fields": [
      { "Name": "Row", "Value": "2" }, { "Name": "Task", "Value": "Design" },
      { "Name": "Start", "Value": "2019-12-27" }, { "Name": "Length", "Value": "10" }
    ]},
    { "Fields": [
      { "Name": "Row", "Value": "3" }, { "Name": "Task", "Value": "Build" },
      { "Name": "Length", "Value": "15" }
    ]}
  ]
}
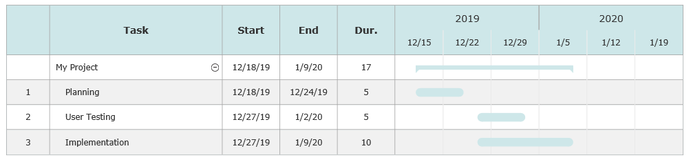
Note that the first task uses the default start value of December 18, 2019 and the second task has the assigned start date of Dec 27, 2019. Setting a new start date resets the default for subsequent tasks so task three has the same start date as task two.
Note also that the scale of the date grid has changed to weeks not days. SmartDraw's intelligent formatting engine will automatically set the grid scale to match your data. If you want more space for the date grid, make the column for this wider. This is explained later.
you can make all days working days by setting AllWorkingDays in GanttOptions:
{
  "Gantt": {
    "GanttOptions": { "AllWorkingDays": true }
  }
}
You can also omit holidays from the working days by setting Holidays to a country: "None", "USA", "UK", "Australia", or "Canada".
{
  "GanttOptions": { "Holidays": "USA" }
}
it is common to subdivide a bigger task into a set of smaller subtasks. The bigger task is described as the "parent" task of the child (or sub) tasks. You can do this in VSON by assigning the Parent field of a task to the Row number of its parent task.
{
  "Rows": [
    { "Fields": [ { "Name": "Row", "Value": "1" }, { "Name": "Task", "Value": "Phase 1" } ] },
    { "Fields": [ { "Name": "Row", "Value": "2" }, { "Name": "Task", "Value": "Research Requirements" }, { "Name": "Parent", "Value": "1" }, { "Name": "Length", "Value": "10" } ] },
    { "Fields": [ { "Name": "Row", "Value": "3" }, { "Name": "Task", "Value": "Create a Prototype" }, { "Name": "Parent", "Value": "1" }, { "Name": "Length", "Value": "10" } ] }
  ]
}
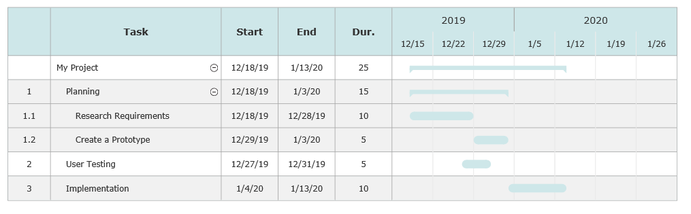
Note that the first subtask (Research Requirements) is set to take 10 days and the second task (Create a Prototype) is set to start 10 days after the first. This is a common pattern where a task starts after another completes. Another way to implement this is with dependency.
You make the start of a task dependent on the end of another by setting the Master field of a task to the Row number of the prerequisite task. The dependent task will begin where the master task ends.
{
  "Rows": [
    { "Fields": [ { "Name": "Row", "Value": "1" }, { "Name": "Task", "Value": "Research" }, { "Name": "Length", "Value": "5" } ] },
    { "Fields": [ { "Name": "Row", "Value": "2" }, { "Name": "Task", "Value": "Design" }, { "Name": "Master", "Value": "1" }, { "Name": "Length", "Value": "10" } ] },
    { "Fields": [ { "Name": "Row", "Value": "3" }, { "Name": "Task", "Value": "Build" }, { "Name": "Master", "Value": "2" }, { "Name": "Length", "Value": "15" } ] }
  ]
}
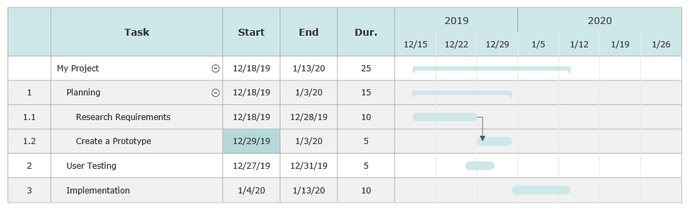
You can control:
- The title of the project
- Which columns appear in the chart
- The width of columns
- The title of some of the columns
- The color of the title cells and bars
- The default properties of the text
Changing the Title of the Project
To name the project, simply set Projectname on the Gantt object.
Adding Columns to the Chart
By default, columns for task number, task name, start, end and duration appear before the date grid. You can columns for:
- Person (Assigned To)
- PercentComplete
- Department
- Cost
- Custom
By including those fields in your task row, or by listing them in GanttColumns. Adding PercentComplete and Person data will add these columns:
{
  "Rows": [
    { "Fields": [
      { "Name": "Row", "Value": "1" }, { "Name": "Task", "Value": "Research" },
      { "Name": "Person", "Value": "Alex Lee" }, { "Name": "PercentComplete", "Value": "100" }
    ]}
  ]
}
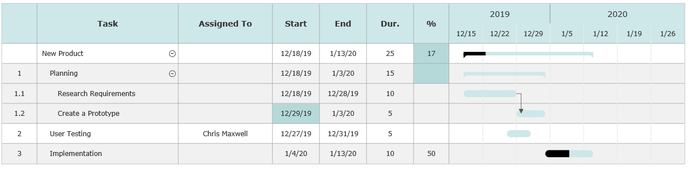
You can also add columns by explicitly setting their width or title in GanttColumns.
Setting the Width of a Column
The columns have default widths. You can override these by listing the column in GanttColumns with a Settings.Width value:
{
  "GanttColumns": [
    { "Name": "Task", "Settings": { "Width": 300 } },
    { "Name": "Person", "Settings": { "Width": 150 } }
  ]
}
Setting the Title of a Column
You can override the default title with Settings.Title:
{
  "GanttColumns": [
    { "Name": "Person", "Settings": { "Title": "Owner" } }
  ]
}
The column names you can rename are Task, Person, Department, Cost, and Custom.
Changing Colors and Text Formatting
The Gantt chart inherits the fill color, line properties, and text properties of the shape that contains it.
To change the title color, fill color, and bar color, set them on the containing shape. Likewise, the default typeface is set using the parent shape.
{
  "Shape": {
    "ID": 1,
    "FillColor": "#2C3E50",
    "TextColor": "#FFFFFF",
    "TextFont": "Helvetica",
    "Gantt": { ... }
  }
}
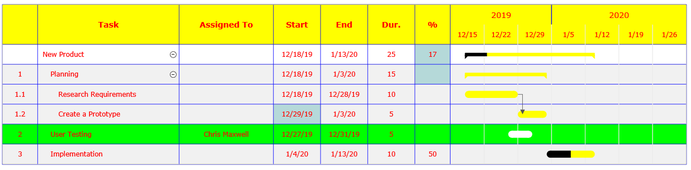
Because Gantt charts are derived from tables, they also support certain table properties. You can color individual columns, set borders, and set widths using GanttColumns, and you can change the appearance of individual task rows using cell-style properties on the row's Fields.
Because a task is derived from the base VSON Cell you can use the normal table cell properties to set:
- Notes
- Hyperlinks
- ExpandedViews
for tasks.