{
  "ID": 1,
  "Label": "An especially long label that should be truncated mid-sentence",
  "Truncate": 30
}
When building a diagram from data, a shape often represents a data record and often data records have multiple fields, each with a different value.
The simplest approach is just to show one value that identifies the record in the shape. For example, in a flowchart of a workflow, show the name of the step in the shape as a Label. But what if you want to show two or more field values in a shape? One way to do this is using a table:
Any shape can be subdivided into a table of cells by setting Rows, and Columns on a Table.
{
  "ID": 1,
  "Table": { "Rows": 3, "Columns": 2 }
}
Each of the six cells in this table can have its own "Label", colors, and so on, just like a shape.
{
  "ID": 1,
  "Table": {
    "Rows": 3,
    "Columns": 2,
    "Cell": [
      { "Row": 1, "Column": 1, "Label": "Name" },     { "Row": 1, "Column": 2, "Label": "Jane Smith" },
      { "Row": 2, "Column": 1, "Label": "Role" },     { "Row": 2, "Column": 2, "Label": "CEO" },
      { "Row": 3, "Column": 1, "Label": "Email" },    { "Row": 3, "Column": 2, "Label": "jane@example.com" }
    ]
  }
}
Tables are very flexible and making them look the way you want is explained in the Table section of this cookbook.
A second way to show multiple values in a shape is to concatenate the values on separate lines. The \n in a text string creates a new line.
{
  "ID": 1,
  "Label": "Jane Smith\nCEO\njane@example.com"
}
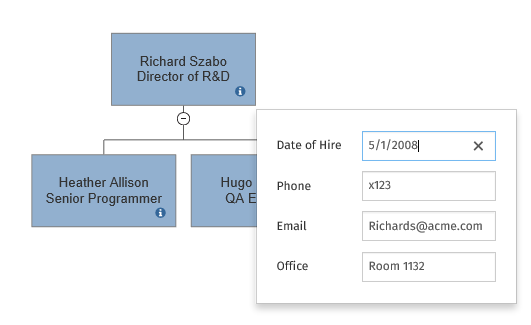
If a shape represents a record with many values it becomes less practical to show them all in the shape itself, even using tables. A third alternative is to show some of the values in a tool tip using Shape Data.
Compare this complicated org chart:
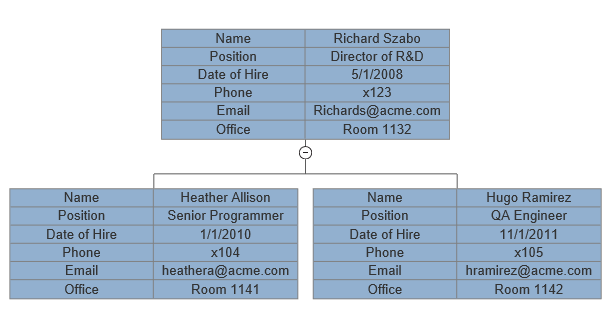
with the same example using shape data:
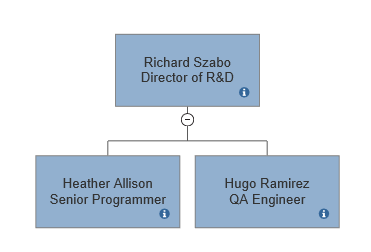
Hovering over the small "i" icon on each shape displays a tool tip that shows the additional data without cluttering up the visual:
Read more about Shape Data with VSON.
Adding a title to your diagram is accomplished by adding a Title object to your VSON document.
{
  "Version": "1.0",
  "Template": "Flowchart",
  "McpGenerated": true,
  "KeepDocument": true,
  "Title": {
    "Label": "Vendor Payment Process",
    "TextBold": true,
    "TextSize": 16
  },
  "Shape": {
    "ID": 1
  }
}
The Title object contains a Label and can be styled with the standard text properties. Entering \n in the label text causes a line break.
The title is centered above the diagram.