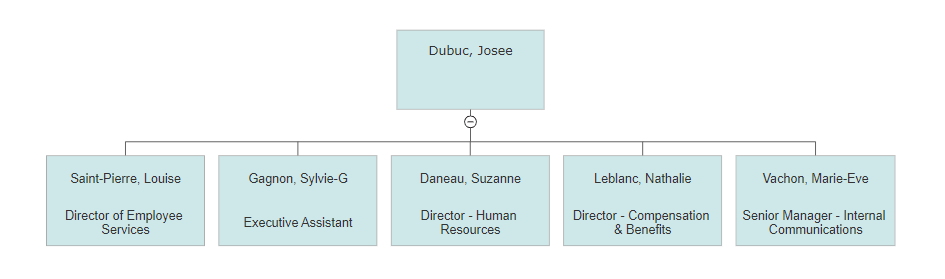
The data required to build an organization chart (or any other hierarchy) requires that the parent child relationships be defined by two columns in the data.
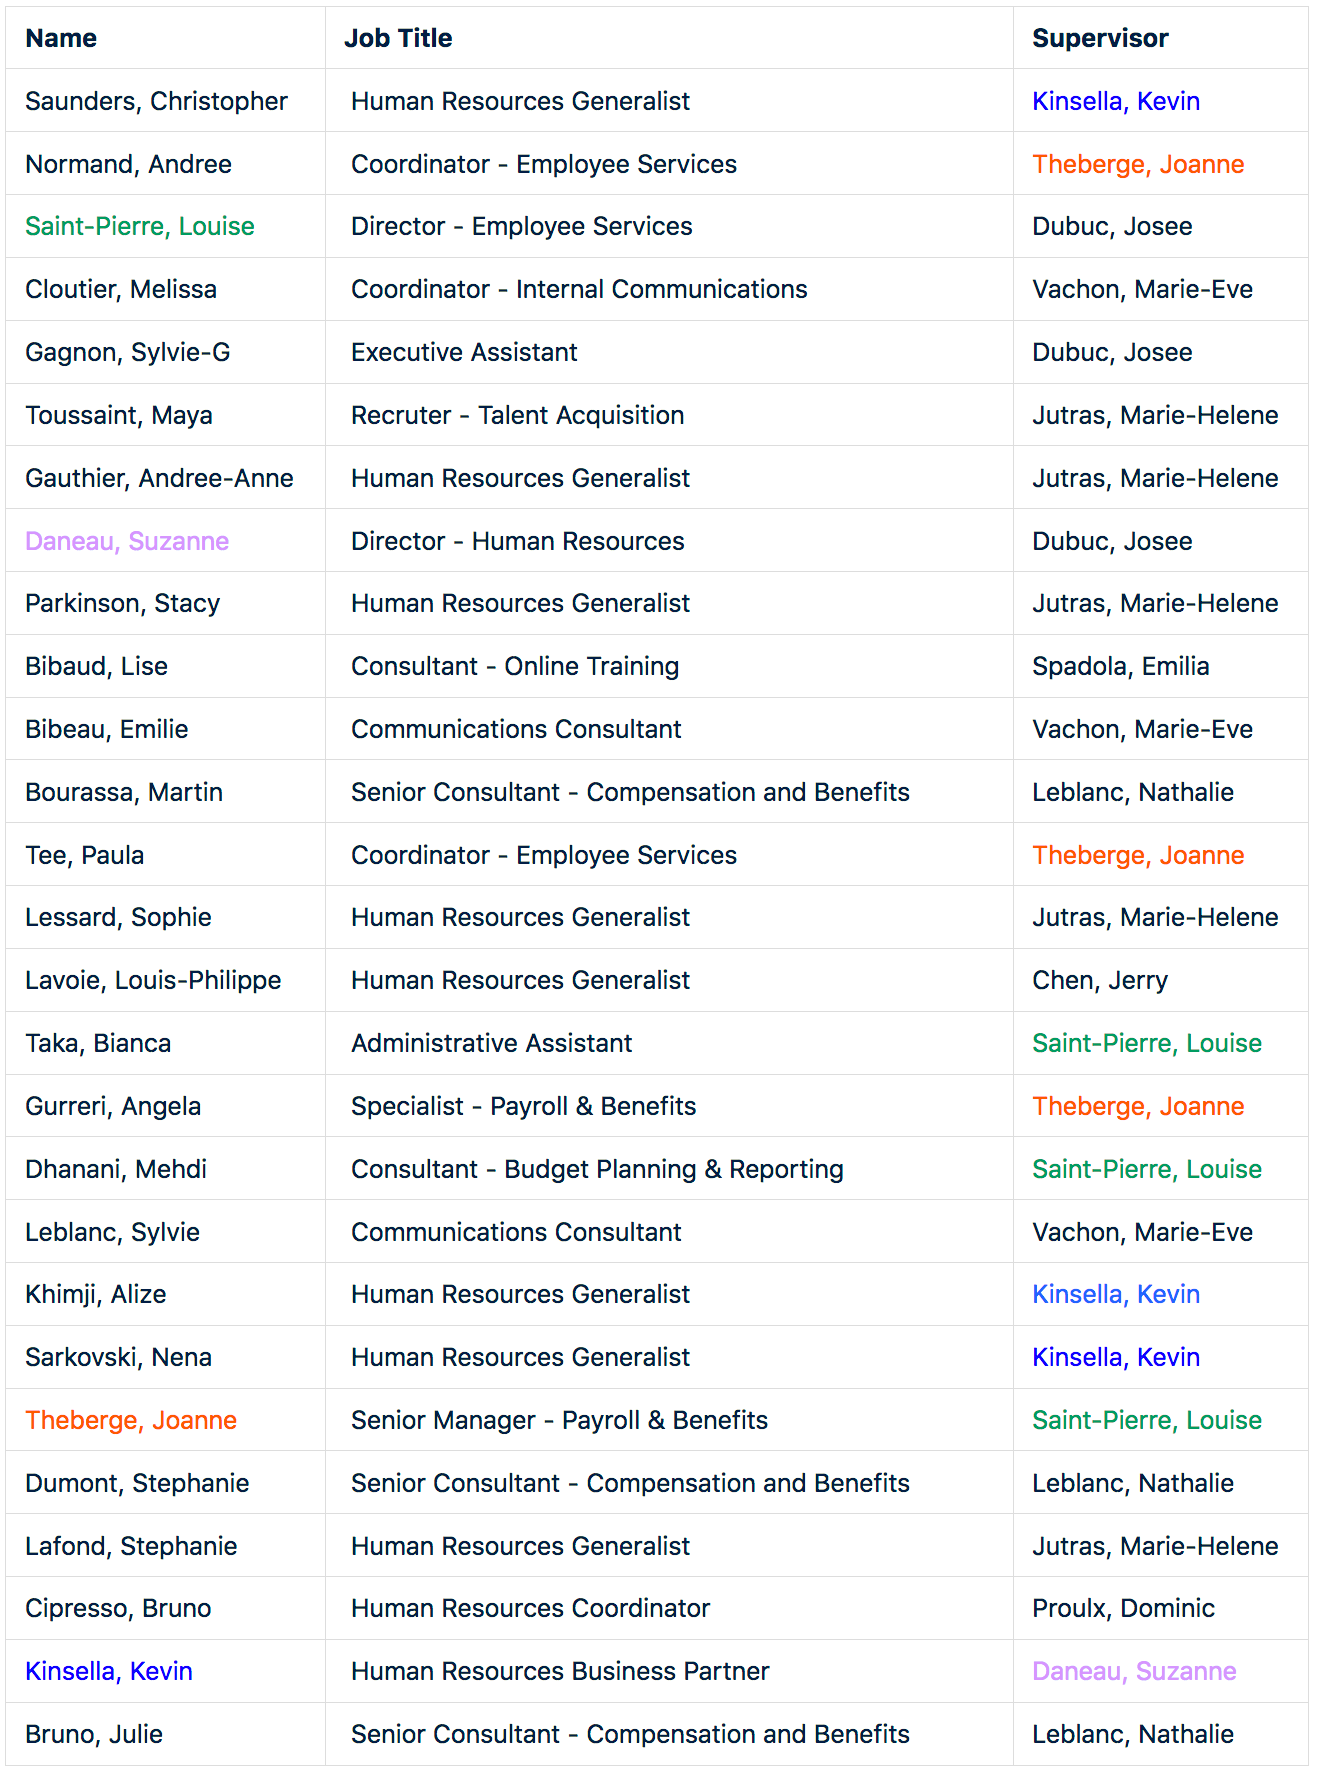
In the above example (a partial data set) the people that report to a supervisor are identified by matching their supervisor value with the supervisor's name value. This is shown with matching colors above.
This allows a program to build a list of subordinates for each person and arrange them in a hierarchy like this:
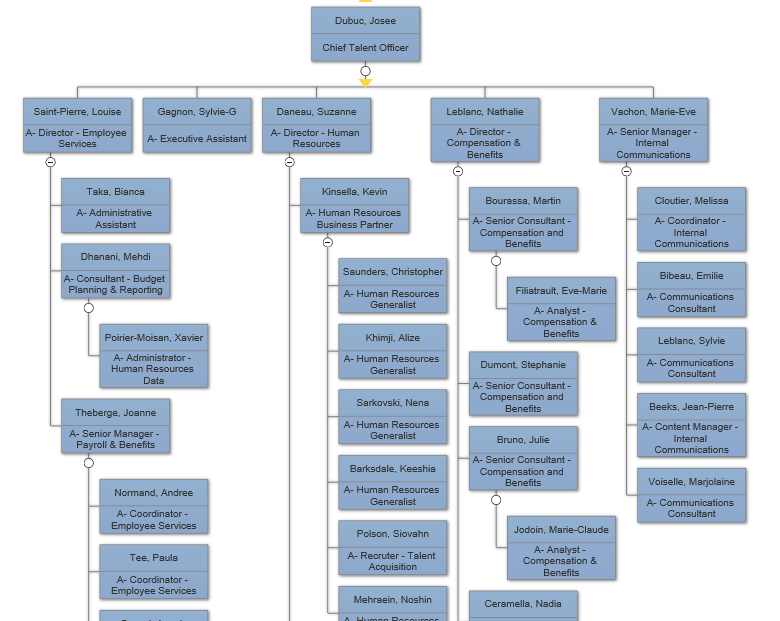
This diagram was built from the data set using VSON. This requires three steps:
- Build a hierarchical data structure by parsing the data.
- Translate the data structure into VSON.
- Use VSON to render the diagram.
- Parse the rows into three fields: Name, Job Title, Supervisor and build an array of row records.
- For each row record add a list of child rows based on matching the supervisor value of a child to the name value of the row.
- Add the parent field to each of the child rows. One of the rows will have no parent. This is the top of the chart.
We end up with an array of row objects that looks something like this:
Rows:[{Name:"Kinsella, Kevin",Title:"Human Resources Business Partner",Manager:9,Children:[7, 11, 34, ...]},....
The first question to be answered in this step is what kind of layout do we want for our diagram? For an organization chart the answer is simple because VSON has a specific format for this using ShapeConnector objects.
A VSON document begins with a root Shape:
{
  "Version": "1.0",
  "Template": "OrgChart",
  "McpGenerated": true,
  "KeepDocument": true,
  "Shape": {
    "ID": 1
  }
}
This shape will represent the row record that is the top of the chart. The top row record has a list of child rows. Each one of these will be represented by a shape in a ShapeConnector of the first shape:
If there are five child rows of the top row, the document looks like this:
{
  "Shape": {
    "ID": 1,
    "ShapeConnector": [
      {
        "ShapeConnectorType": "OrgChart",
        "Shapes": [
          { "ID": 2 },
          { "ID": 3 },
          { "ID": 4 },
          { "ID": 5 },
          { "ID": 6 }
        ]
      }
    ]
  }
}
The first child shape itself has three child shapes. So it too has a ShapeConnector:
{
  "ID": 2,
  "ShapeConnector": [
    {
      "ShapeConnectorType": "OrgChart",
      "Shapes": [
        { "ID": 7 },
        { "ID": 8 },
        { "ID": 9 }
      ]
    }
  ]
}
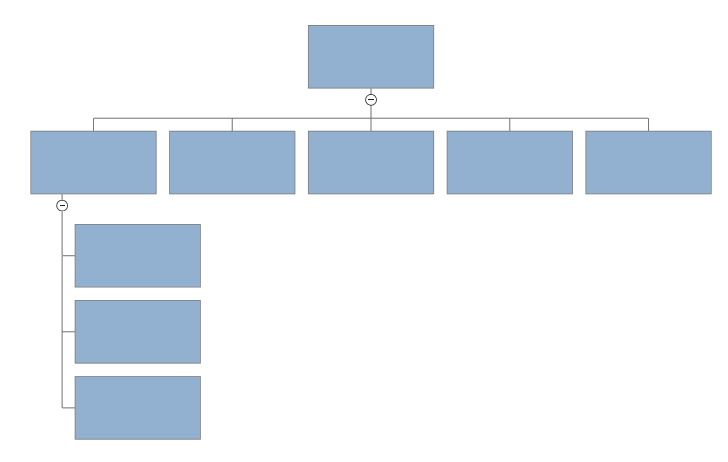
The nested ShapeConnector objects define the structure of the org chart tree.
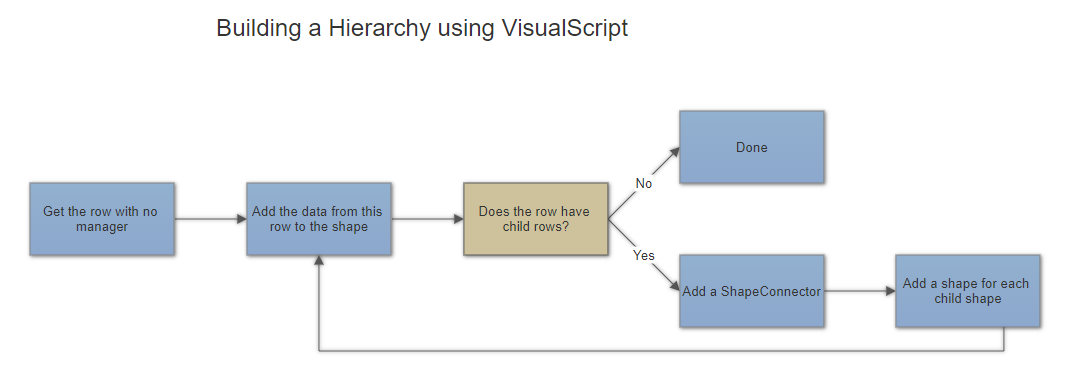
The algorithm for building the VSON for an org chart is as follows:
- Start with the top row and put its data into the root shape.
- Add a ShapeConnector to the root shape with an array of Shape objects: one for each child row of the top shape.
- Add the data for each of these child rows to the shapes in the ShapeConnector array.
- If a child shape has children of its own, add a ShapeConnector to this shape with an array of Shape objects: one for each child and repeat steps 2-4 in a recursive way.
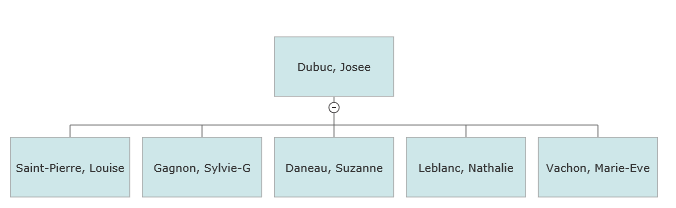
The simplest way to transfer the data from each row into a shape is to add a "Label" to each shape showing the employee's name:
{
  "ID": 1,
  "Label": "Smith, Jane",
  "ShapeConnector": [
    {
      "ShapeConnectorType": "OrgChart",
      "Shapes": [
        { "ID": 2, "Label": "Lee, Alex" },
        { "ID": 3, "Label": "Rivera, Sam" }
      ]
    }
  ]
}
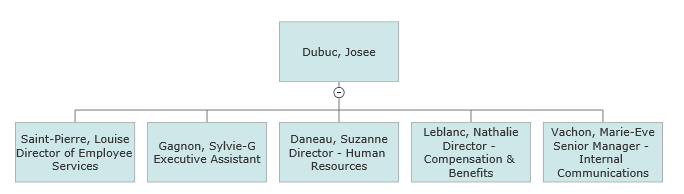
Let's assume we also want to add the job titles to each shape. One easy way to do this is to add a second line label using \n as a line break.
{
  "ID": 1,
  "Label": "Smith, Jane\nCEO"
}
We can show multiple bits of data more elegantly by adding a Table to each shape and assigning the name field to one row and the position or title to the other row.
{
  "ID": 1,
  "Table": {
    "Rows": 2,
    "Columns": 1,
    "Cell": [
      { "Row": 1, "Column": 1, "Label": "Smith, Jane" },
      { "Row": 2, "Column": 1, "Label": "CEO" }
    ]
  }
}
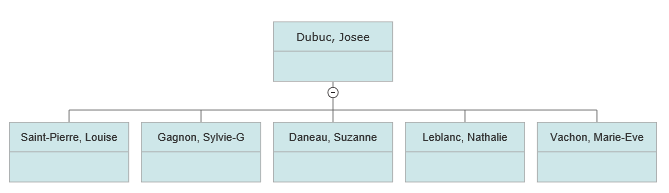
Note that the original table definition of two rows is inherited by the shapes below.
You can put the title in the second cell for each child by including a Table on each child shape with a Cell array that fills the second row.
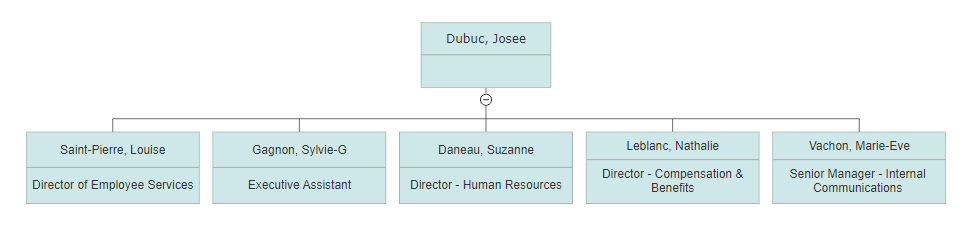
Perhaps you want the spacing that the table gives you, but not the line between the two rows. You can remove this divider using RowProperties for the first row and setting its line thickness to 0. We can make the shapes look better at the same time by setting the text margin for the shape to 6/100".
{
  "ID": 1,
  "TextMargin": 6,
  "Table": {
    "Rows": 2,
    "Columns": 1,
    "RowProperties": [
      { "Index": 1, "LineThick": 0 }
    ],
    "Cell": [
      { "Row": 1, "Column": 1, "Label": "Smith, Jane" },
      { "Row": 2, "Column": 1, "Label": "CEO" }
    ]
  }
}